Due to the emerging COVID-19 pandemic,
JGI will not be accepting or processing any physical samples
because of reduced onsite staffing until further notice. IMG is still accepting bioinformatic data sets via
IMG Submission Site
Statistical Analysis User Guide
The "Statistical Analysis" tool enables users to quantitatively compare counts of functional genes
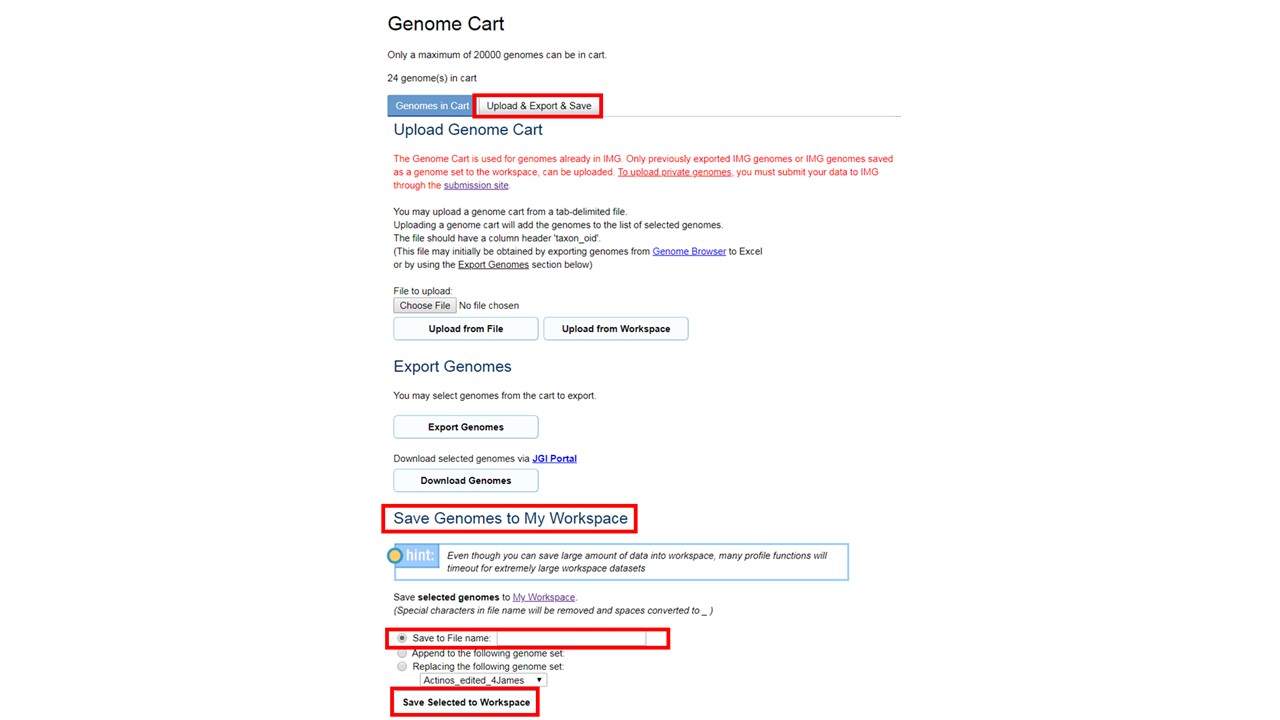
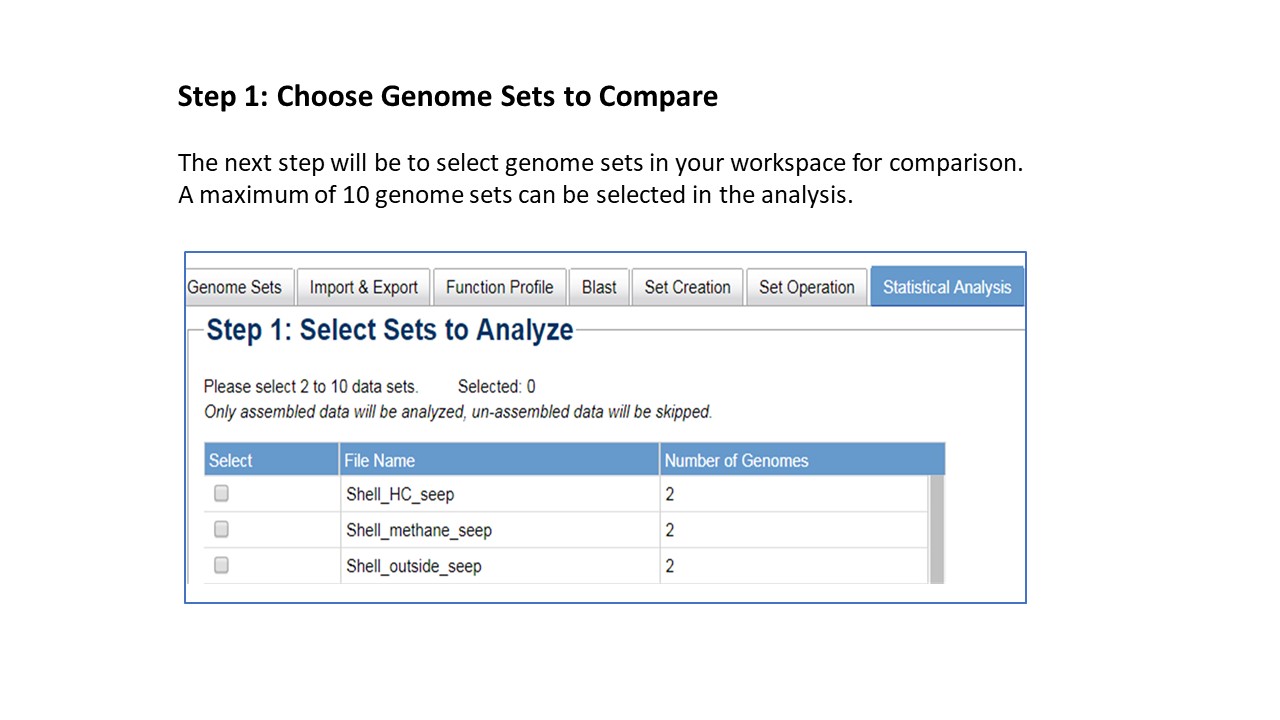
between groups of genomes or metagenomes. To get started, user must select and save genomes or
metagenomes of interest as discrete "Genome Sets" in workspace. Genome sets can be created from
the genome cart using "Upload & Export & Save" (see below).
Please refer to the
IMG workspace user Guide for more details on other workspace functions and options.
SOME EXAMPLES OF PUBLICATIONS that employ statistical methods like these are given below:
Levy, A. et. al. Genomic features of bacterial adaptation to plants. Nature Genetics. 50(1):138-150 (2018).
doi: 10.1038/s41588-017-0012-9.
Seshadri, R. et. al. Cultivation and sequencing of rumen microbiome members from the Hungate1000 Collection.
Nature Biotechnology. 36(4):359-367 (2018).
doi: 10.1038/nbt.4110.
Vigneron, A. Comparative metagenomics of hydrocarbon and methane seeps of the Gulf of Mexico.
Scientific Reports. 7(1):16015 (2107).
doi: 10.1038/s41598-017-16375-5.
For this feature, the numbers of
genes assigned to a lineage (based on predicted lineage of the scaffold that the genes reside on)
are compared across the metagenome sets.
IMG scaffold lineage is predicted based on the last common ancestor of LAST hits
(against IMG-NR isolates database) of the genes on the scaffold,
where at least 50% of the genes have LAST hits with at least 30% sequence identity against
the database of reference isolate genomes.
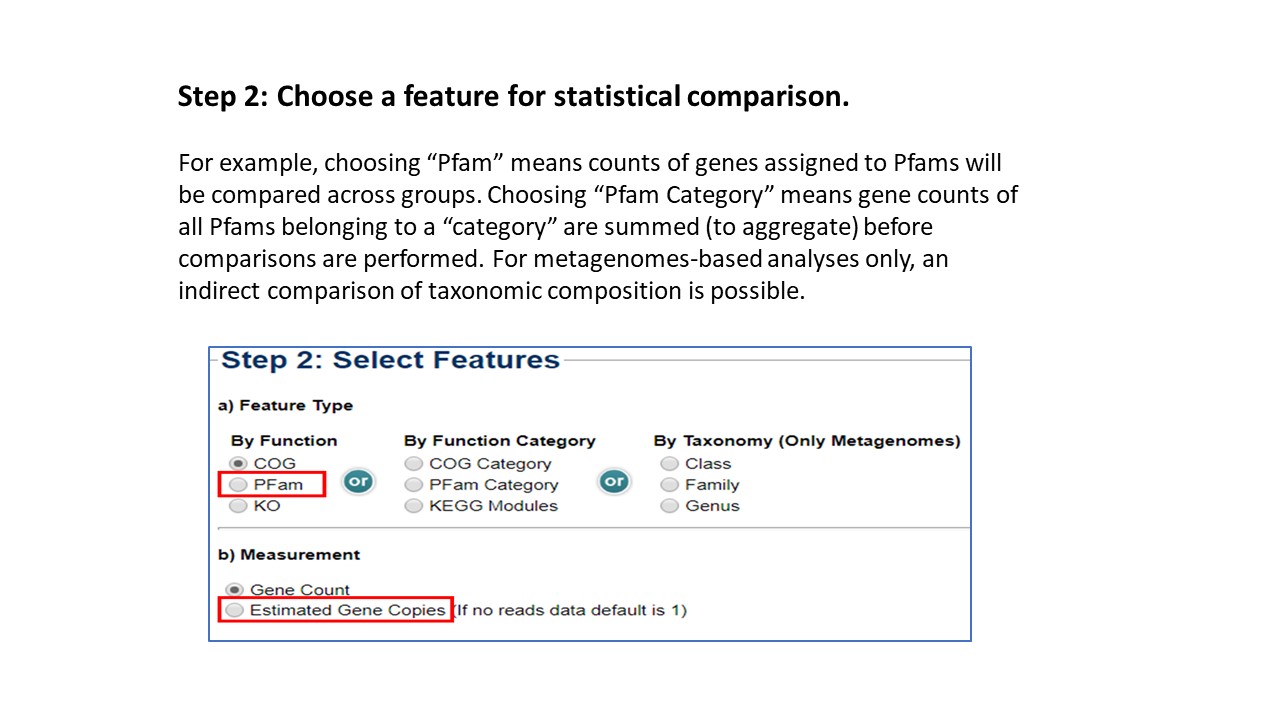
Again, for metagenomes only, step 2b
(Measurement) allows user to select "estimated gene copies" so that gene counts reflect copy
number based on their abundance in the sample - specifically, the gene count is multiplied by
average read depth of the scaffold that the gene resides on.
CAUTION: user must verify that read depth information is available for all their chosen
samples in all groups.
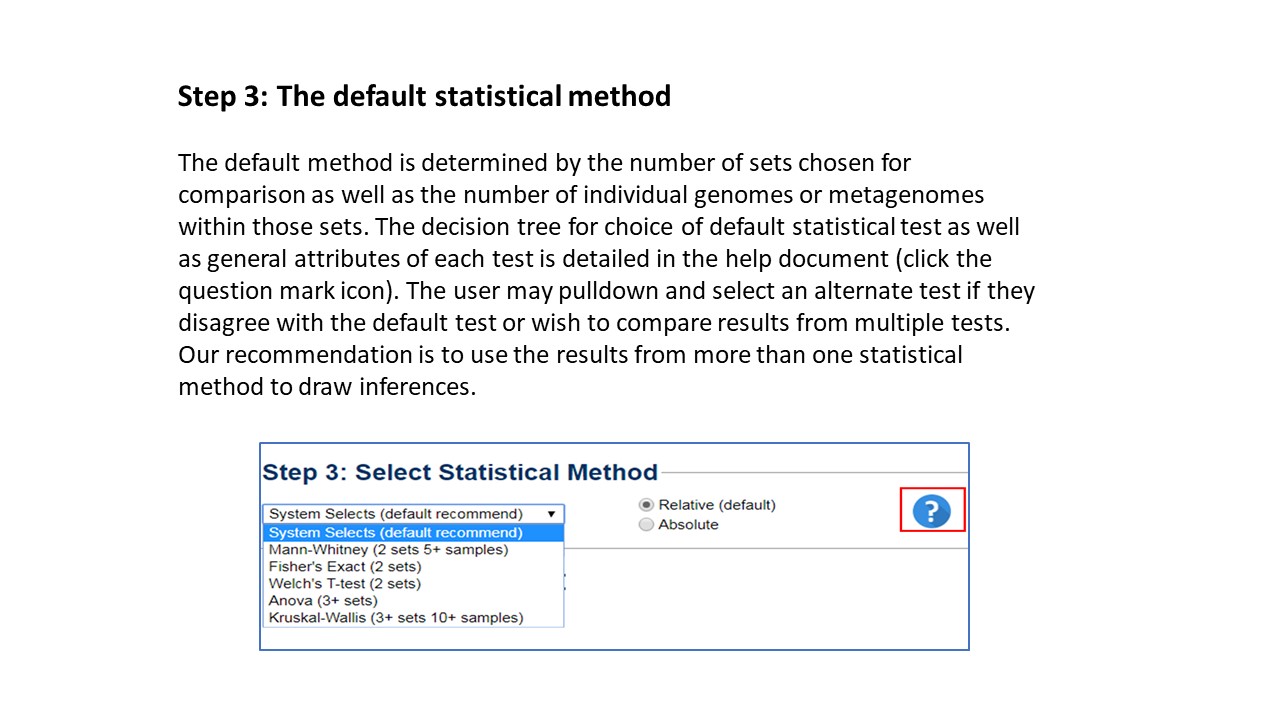
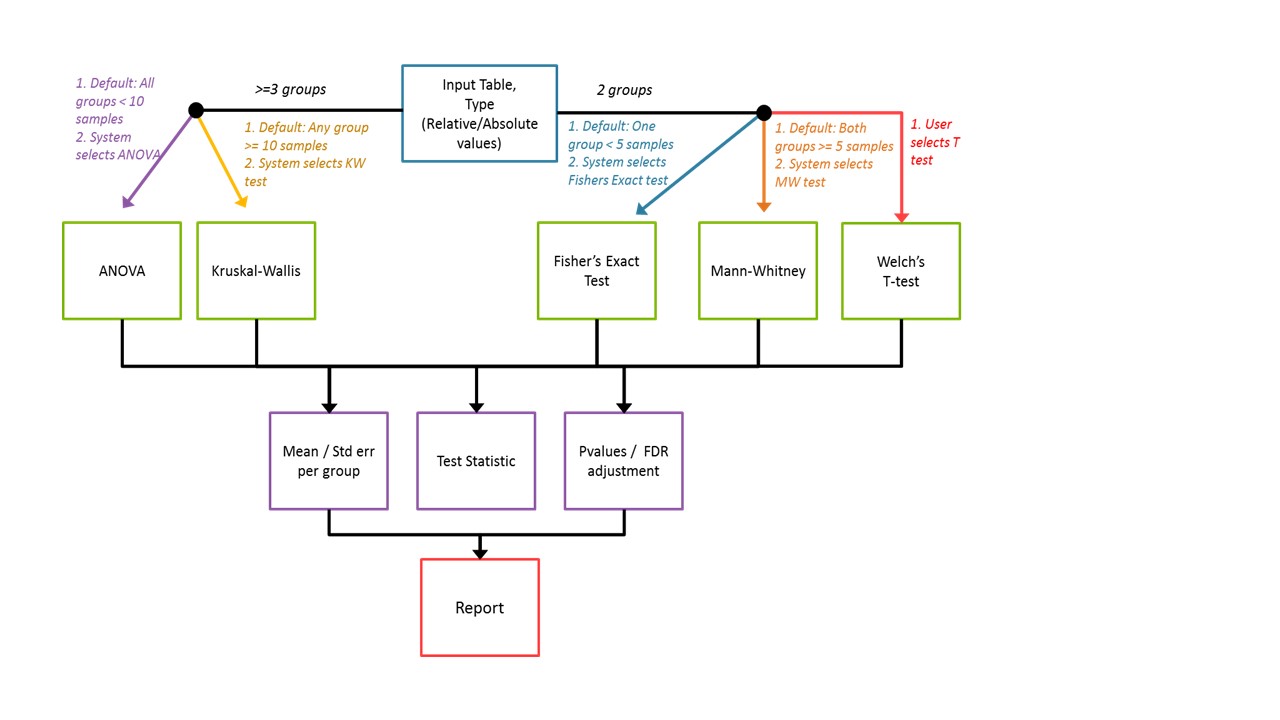
The IMG system determines a default statistical method based on the input number of "sets" or
groups for comparison, as well as the number of individual taxons within a group. The decision tree
used for choice of default method is shown below.
The user may select an alternate test if they wish. Our recommendation is to use these tools
for a preliminary data exploration and to use more than one statistical approach to assess results
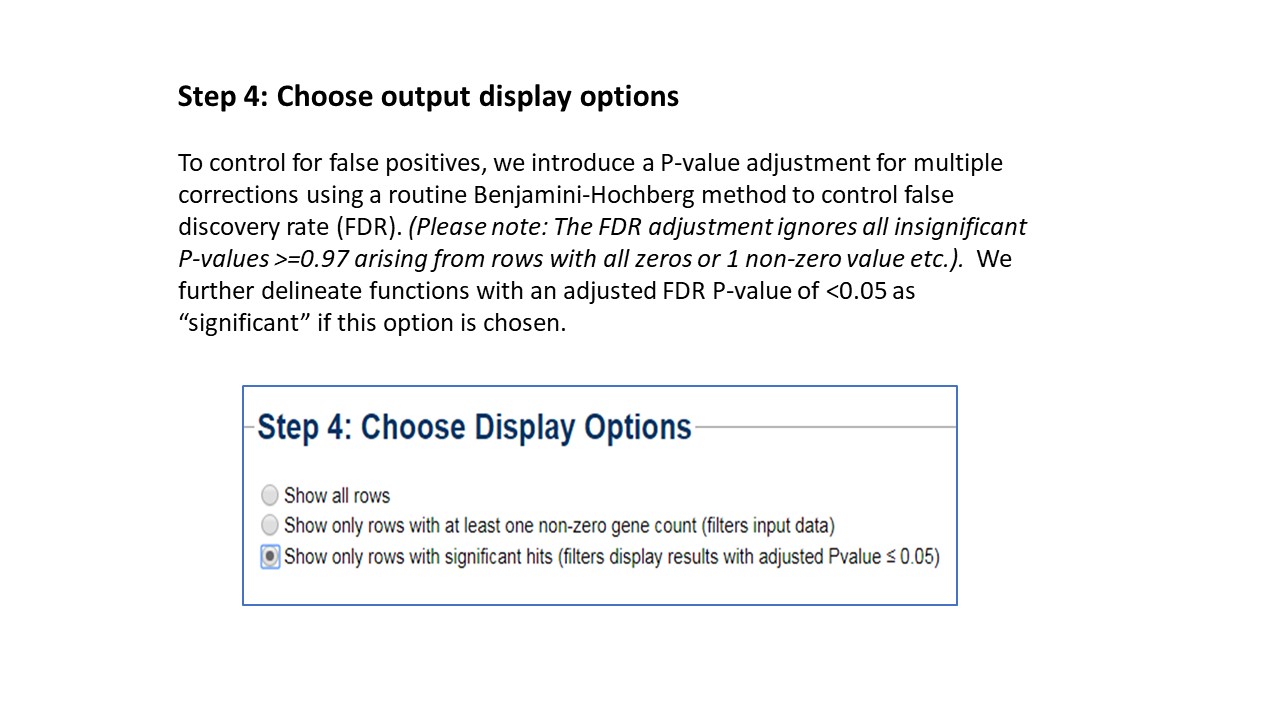
before drawing inferences. To control for false positives, we introduce a P-value adjustment for
multiple corrections using a routine Benjamin Hochberg method to control false discovery rate (FDR).
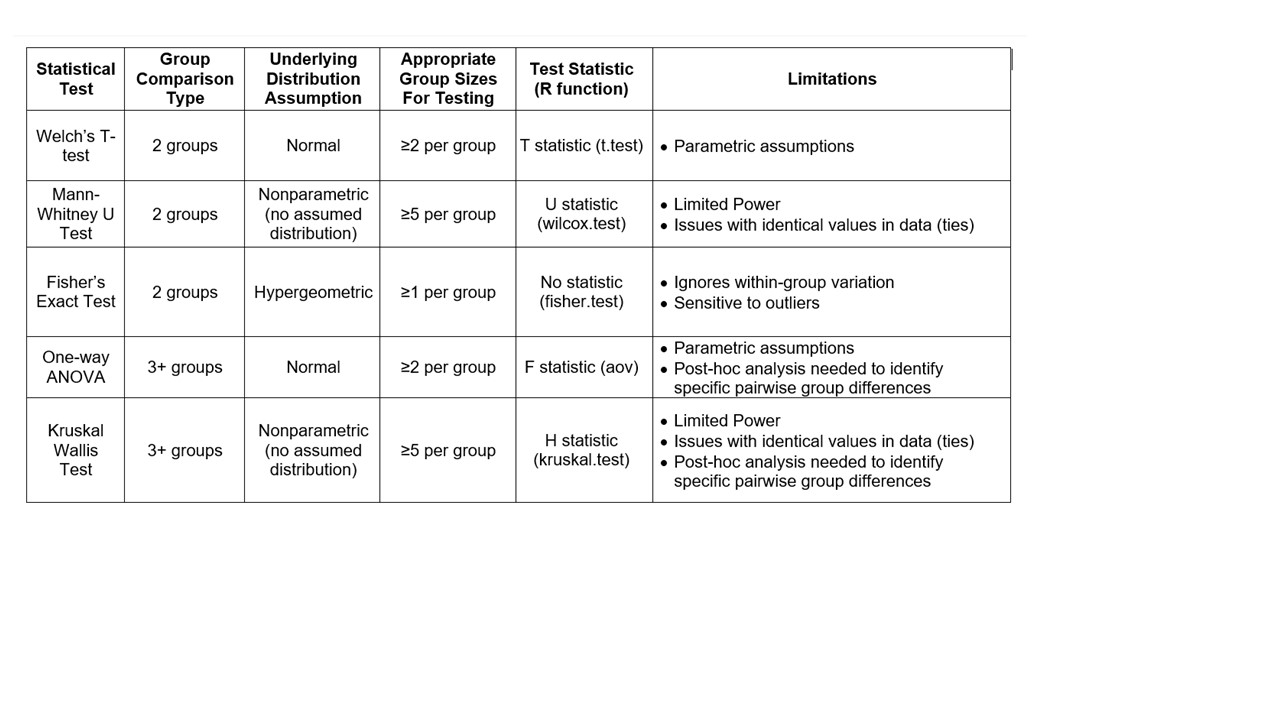
The attributes of each test are summarized in the table below.
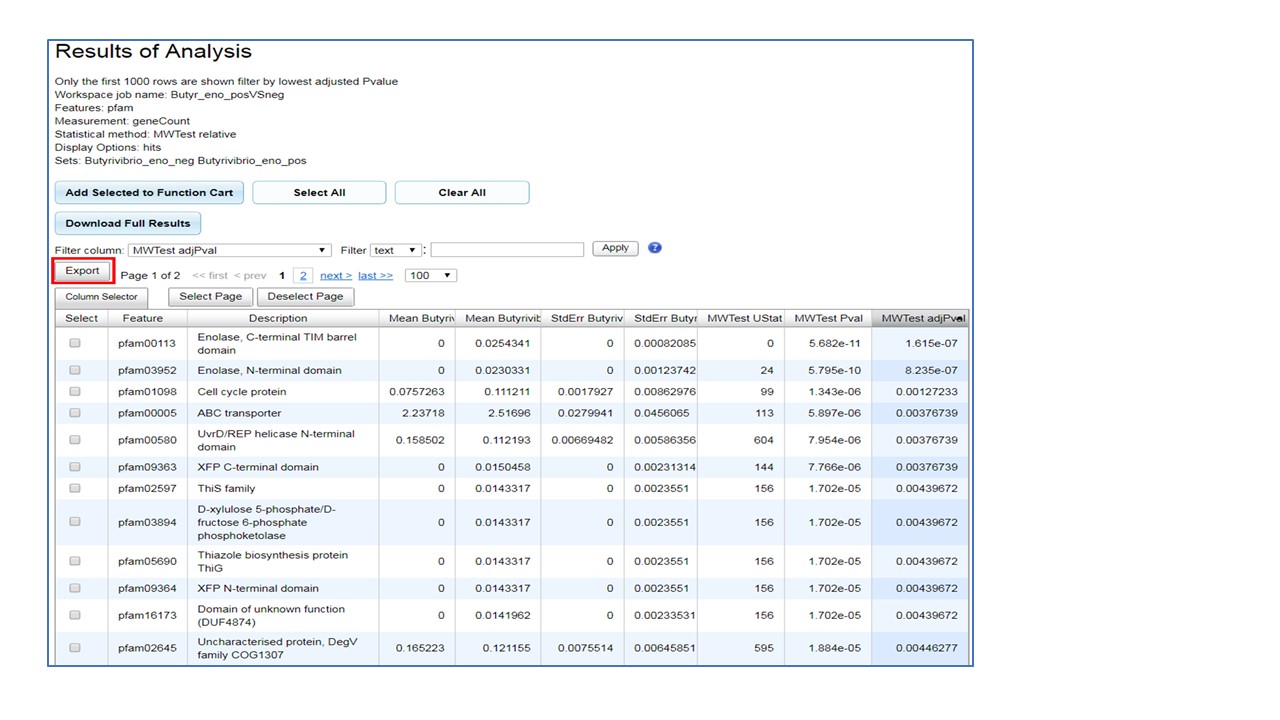
The results table displayed in the user interface will include only up to 1000 rows and is displayed
in ascending order of the FDR adjusted P-value (last column). Table columns are feature ID,
feature name, mean gene count for each genome set submitted for analysis, standard error of mean
for each set, P-value and FDR error-corrected P-value. This table can be downloaded using "Export".
The "Download Full Results" produces a compressed folder with multiple files - the UI_data_output file
is a table with all rows and all columns (described above), as well as additional columns of normalized
and raw gene counts for every genome in every set. Finally, user can select features of interest
and add to the Function Cart for downstream analyses.